


Take guard

You give cricket everything. Now see what it gives back.

Every session, squad and match on one record. See what was trained, who improved and what to do next. Have you changed your guard yet?

Swipe to explore. Tap a card to find your crease.

Schools

Questions you can’t answer today

    These are the questions CreaseTech is being built to answer, from one record.

    Throw away the group chats and note pads. Get answers, not guesswork.

    Leave the admin chaos at the gate. Scheduling is handled, so you can focus on the cricket.

    Swipe to explore schools, coaches, players and parents.

    Schools, academies and clubs

    Before: Selection argued from memory. Nets double-booked. Nobody ready to replace the leavers.

    One home for the programme. It outlasts every staff change.

    • Grounds, nets and sessions in one calendar, with clashes shown as you make them.
    • Squad depth by role: who is leaving, and who is ready next.
    • Selection backed by attendance, training and match records.
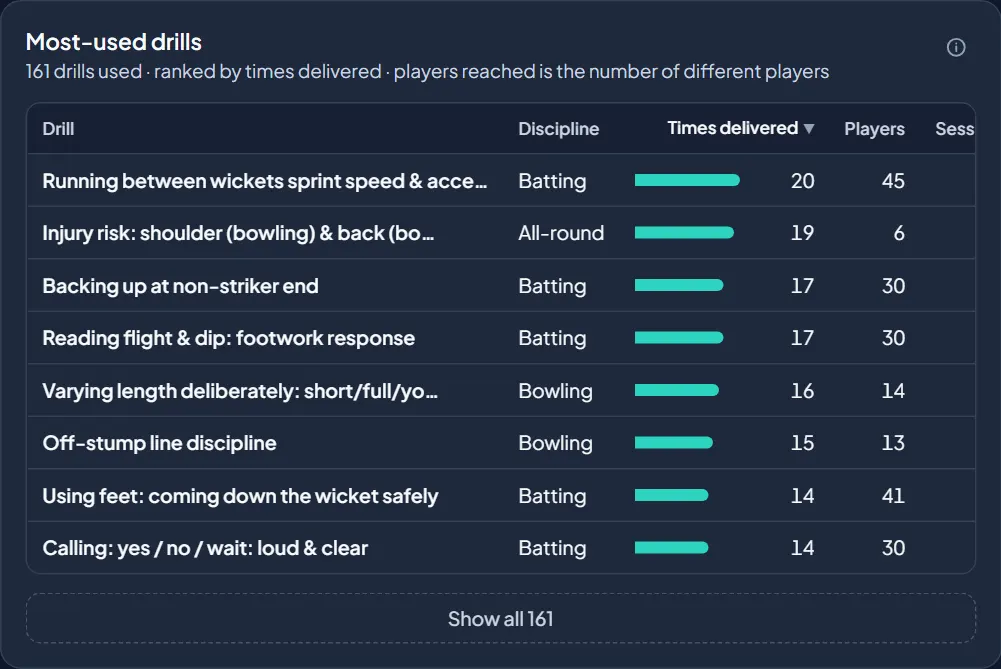
    Most-used drills, ranked by times delivered and players reached. Sample data.

    Coaches

    Before: No record of what was trained, or who missed it. The same weakness every season. Admin eating your coaching time.

    Your sessions, drills and judgement, kept and credited to you.

    • Every session logged: who trained, which drills, which skill areas.
    • Gaps shown per player, so the next session targets the weakness.
    • A portfolio that moves with you between schools.
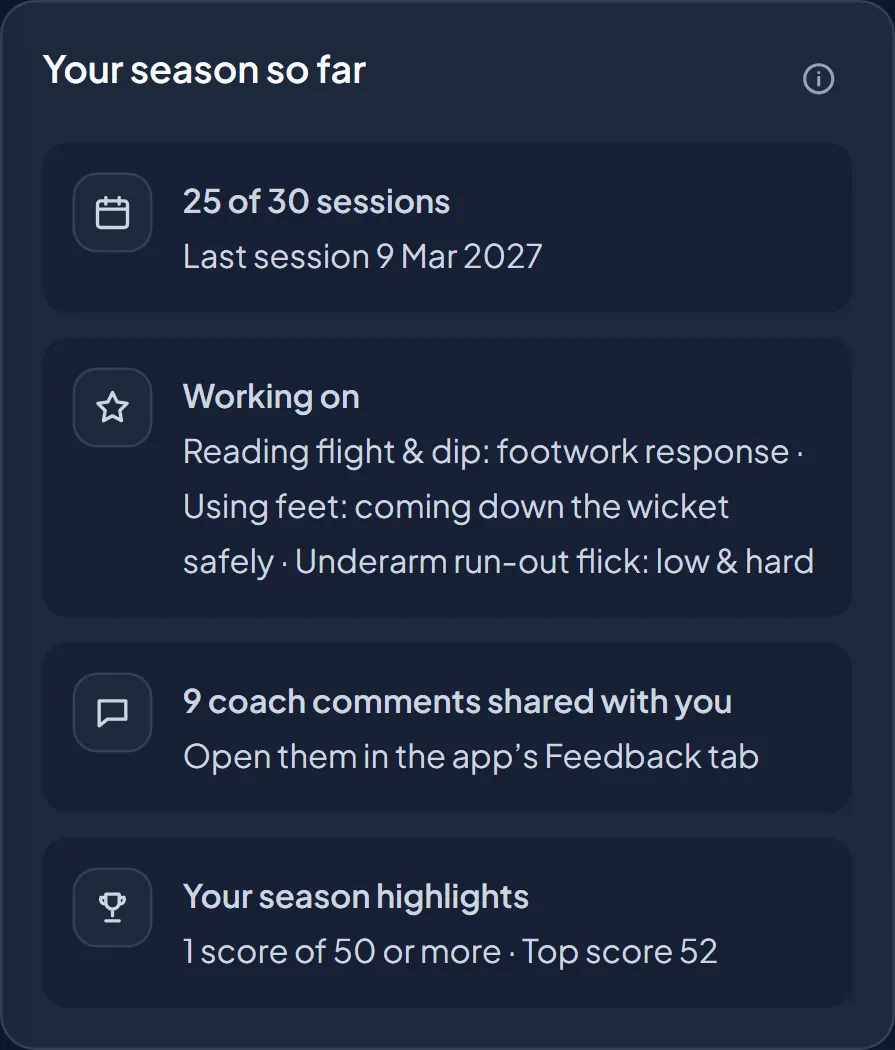
    A player’s season so far: sessions attended, what they are working on, coach comments and highlights. Sample data.

    Players

    Before: No idea what you have actually trained. Feedback gone by the next session. Change clubs and start from zero.

    Every innings and session on one record that’s yours.

    • Every session, drill and innings on your own record.
    • Your strengths and what to work on next, with your coach’s notes kept.
    • It moves with you between school, academy and club.
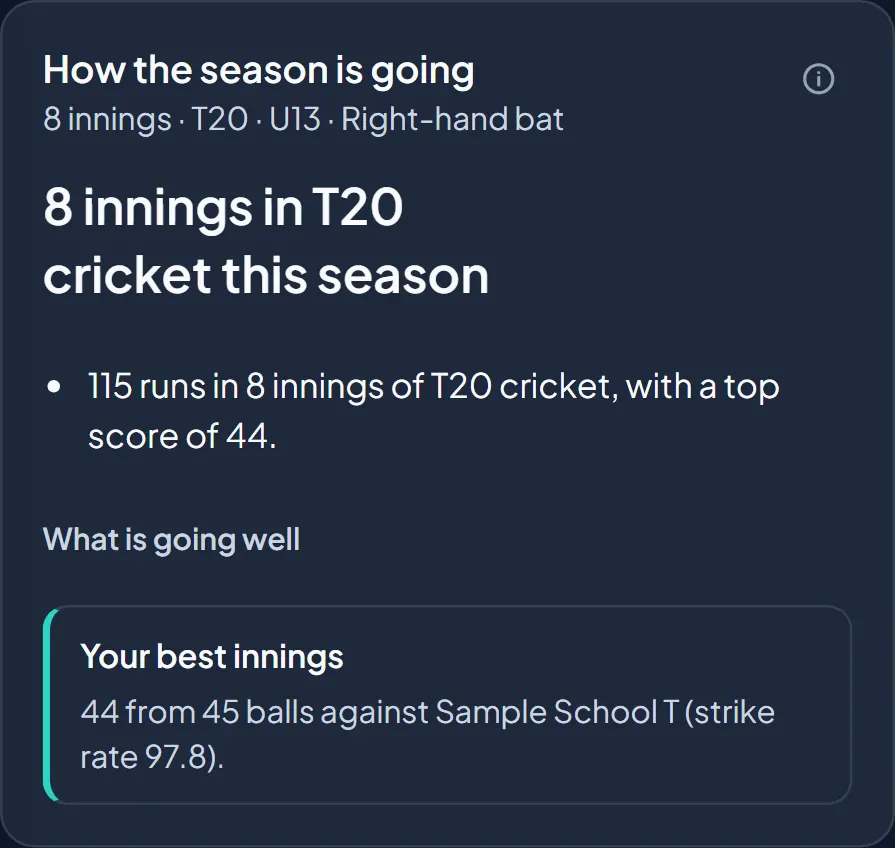
    A parent’s view of how the season is going, in plain words. Sample data.

    Parents

    Before: Fees paid. Progress hard to see. Selection never explained.

    Your own child’s progress, in plain words, with you in control.

    • Attendance, training done and coach feedback, in plain words.
    • Sessions, matches and changes in one place, not five chat groups.
    • You decide what’s shared, and can change your mind.

    None of this is anyone’s fault. All of it is fixable.

    Take guard
    • Launching February 2027
    • Built for school, club and academy cricket

    Product screens show sample data.

    Cricket has never been short of talent. It has been short of memory.

    1. Vision

      A game where every cricketer’s effort is seen, kept and carried forward, however far they go.

      Grassroots to international

    2. Mission

      To make every cricketer’s journey count, not only the ones that end in a cap.

      Every session and innings, kept on one record that’s yours and outlasts any coach or term.

      Every session. Every innings.

    3. What we believe

      • The record belongs to the player.
      • The player at the far net deserves what the top of the game gets.
      • Effort deserves to be kept long after the season closes.

      Yours to keep

    Train and play like a pro and get treated like one.

    Kept like the international game, at every level

    • Grassroots
    • Social
    • School
    • Club
    • Domestic
    • Academy

    CreaseTech exists to keep the evidence, and to turn it into better decisions.

    Meet the founders

    Season after season. See how you get better.

    Each turn of the season adds to three records at once: the player's, the squad's and the academy's.

    The Record

    Player
    1. Nets: 40 drives, coach note
    2. Saturday: 14 runs, 1 catch
    3. Five innings, one form line
    4. Starts not turning into runs
    5. Next block: convert starts
    Squad
    1. U19 nets: 14 of 16 present
    2. Two-day game: result in
    3. Season results in one view
    4. No spin drills this term
    5. Spin added to Tuesday nets
    Academy
    1. Week 6 of term delivered
    2. Every fixture's scorecard kept
    3. Formats tracked separately
    4. Batting: 67% of drill time
    5. Term 2 built from the Record

    Sample data.

    Swipe through the season. Tap a dashboard to enlarge.

    Train

    Sessions, drills and reps go on a phone at the ground, before anyone leaves.

    This term's training

    Player 05 · U17 · two programmes

    2026/27
    Minutes1,805
    Sessions25 of 30
    Drills38

    Where the minutes went, by programme and skill area

    • Term 1 · Test765 min
    • Term 2 · ODI + T201,040 min
    • Technical1,080
    • Tactical190
    • Physical315
    • Mental220

    1,031 balls faced273 throws204 reps

    Sample data.

    Play

    Match scorecards come in from the scoring source. Nobody types them up twice.

    Two-day results

    U19 · four matches · first-innings lead earns the points

    2026/27

    1 win from 4

    • Outright win1
    • Drawn, opposition led1
    • Outright loss2
    Conversion gap: 0. No draw was spent ahead on first innings. One was spent behind.
    Sample data.

    Look at the numbers

    Innings by innings, the season reads as one line, not a pile of paper.

    Form, innings by innings

    U13 Player 05 · last five innings

    T20
    Runs32
    Average16.0
    Not out3 of 5

    Runs per innings, with strike rate

    1. 7*24 OctSR 178
    2. 147 NovSR 117
    3. 623 JanSR 72
    4. 4*6 FebSR 135
    5. 1*6 MarSR 101
    • Out
    • Not out (*)
    Sample data.

    Find out why

    See how the wickets fell and where the pattern starts. The coach still decides why.

    How 100 wickets fell

    All squads · this season · counts, not rates

    Scorecards
    • Caught38
    • Bowled26
    • LBW12
    • Caught behind8
    • Caught and bowled7
    • Run out7
    • Stumped2
    64 of 100 were caught or bowled. The pattern shows where to look. The coach still decides why.
    Sample data.

    Plan

    What the numbers show goes back on the board, and the next block is planned from it.

    One thing to work on

    Player 05 · next block, set by the coach

    Plan

    Starts turned into fifties

    1 of 4

    Aim: 1 in 3 You got to 20 four times and went on to 50 once.

    Next block

    Reading the match situationScore management by over

    We'll check, over 10 innings0 of 10 played
    Sample data.

    Then it turns again, with more to go on.

    See what the Record shows

    Every dashboard answers one question.

    Screens from the analytics we are building for launch, on made-up players and schools.

    Stumps on the season

    U13 team · T20 · eight matches

    2026/27
    Fixtures8
    Won4
    Lost4
    Runs per 100 balls84.0
    Runs per over conceded5.40

    The season, match by match, with the run margin

    1. Won +2110 Oct
    2. Won +224 Oct
    3. Lost −17 Nov
    4. Lost −121 Nov
    5. Won +323 Jan
    6. Lost −16 Feb
    7. Won +120 Feb
    8. Lost −226 Mar

    Bowled the opposition out once in eight innings, at a wicket every 25.8 balls. The leading wicket-taker (8) leaves the age group after this season.

    Who carried the bat

    Share of team runs and team wickets, weighted equally

    U13 · T20
    1. U13 Player 07All-rounder · 11.6y14.0%
    2. U13 Player 12All-rounder · 11.3y12.6%
    3. U13 Player 09Spin bowler · 12.5y · leaving11.4%
    4. U13 Player 13All-rounder · 12.8y · leaving9.6%
    5. U13 Player 05Fast bowler · 12.8y · leaving9.2%
    6. U13 Player 06Fast bowler · 12.4y · leaving8.1%
    7. U13 Player 03Top order · 11.6y7.3%
    8. U13 Player 01Top order · 12.2y · leaving6.7%
    • Returning next season
    • Leaving the age group

    Every fixture, scored

    U13 Inter-School T20 Cup 2026/27, newest first

    8 matches
    DateOppositionResultU13 teamOppositionRun margin
    6 MarSample School XLost100/8 (20)122/4 (20)−22
    20 FebSample School TWon102/6 (15.4)101/3 (20)+1
    6 FebSample School RLost90/6 (20)91/4 (19.2)−1
    23 JanSample School NWon123/8 (18.5)120/6 (20)+3
    21 NovSample School XLost80/3 (20)81/1 (14)−1
    7 NovSample School KLost110/7 (20)111/5 (17.4)−1
    24 OctSample School NWon111/7 (19.5)109/2 (20)+2
    10 OctSample School QWon111/8 (20)90/10 (19.4)+21

    Six of the eight were decided by three runs or fewer.

    The run makers

    Top three by runs, U13 team, T20

    Batting
    #1 · U13 Player 03Top order · 11.6y115 runs16.4 avg88.5 SR0 × 50+
    #2 · U13 Player 01Top order · 12.2y · leaving105 runs13.1 avg63.3 SR0 × 50+
    #3 · U13 Player 04Middle order · 11.8y87 runs17.4 avg88.8 SR1 × 50+

    Team: 784 runs in 69 batting innings, 14.8 runs per wicket, 84.0 runs per 100 balls.

    The wicket takers

    Top three by wickets, with their share of the overs

    Bowling
    #1 · U13 Player 09Right-arm off-break · 12.5y · leaving8 wkts17.3%19.5 balls / wkt5.65 econ
    #2 · U13 Player 12Right-arm off-break · 11.3y7 wkts11.5%14.9 balls / wkt5.60 econ
    #3 · U13 Player 07Left-arm medium-fast · 11.6y6 wkts13.9%21.0 balls / wkt5.00 econ

    Team: 35 wickets in 150.4 overs, 23.3 runs per wicket conceded, 5.40 an over.

    Engine room

    Where the runs come from, by batting position

    Share of runs
    1. Positions 1 to 324 innings · 312 runs39.8%13.6 avg45.8% ended on 10 or fewer17.4% bowled or lbw
    2. Positions 4 to 623 innings · 229 runs29.2%11.5 avg65.2% ended on 10 or fewer35.0% bowled or lbw
    3. Positions 7 to 919 innings · 238 runs30.4%23.8 avg52.6% ended on 10 or fewer30.0% bowled or lbw
    4. Positions 10 and 113 innings · 5 runs0.6%n/a avg100.0% ended on 10 or fewern/a bowled or lbw

    Lots of low scores at 1 to 3 is a getting-in problem: train survival. Starts piling up at 31 to 49 with few fifties is a going-on problem: train concentration.

    Getting in, getting out

    69 innings by score, and how 53 of them ended

    U13 · T20

    Innings by score band

    1. 90
    2. 301 to 10
    3. 2511 to 30
    4. 431 to 49
    5. 150 to 99
    6. 0100+

    Dismissal mode

    • Caught29
    • Bowled10
    • Run out6
    • LBW4
    • Caught and bowled3
    • Stumped1

    Dismissed by

    Spin 19Pace 28

    Counts, not rates. Scorecards do not publish balls faced against pace and spin. 26.4% of dismissals were bowled or lbw, so that is where to point the camera.

    Who does the damage

    Each style's share of wickets against its share of overs

    Insufficient evidence
    • Share of overs
    • Share of wickets
    1. Right-arm off-break48.6% of wickets
      46.7% of overs
    2. Right-arm medium8.6% of wickets
      14.4% of overs
    3. Left-arm medium-fast17.1% of wickets
      13.9% of overs
    4. Right-arm medium-fast14.3% of wickets
      13.3% of overs
    5. Right-arm fast-medium11.4% of wickets
      11.7% of overs

    Left-arm medium-fast takes 17.1% of the wickets from 13.9% of the overs. Strong evidence needs 250+ overs of a style; every style here is below 80.

    Who tested us

    Net runs per wicket (for minus against), by opposition

    U13 · T20
    1. Sample School XMet 2 · won 0 · lost 2−24.2Indicative
    2. Sample School TMet 1 · won 1 · lost 0−16.7Anecdote
    3. Sample School NMet 2 · won 2 · lost 0−13.0Indicative
    4. Sample School RMet 1 · won 0 · lost 1−7.8Anecdote
    5. Sample School KMet 1 · won 0 · lost 1−6.5Anecdote
    6. Sample School QMet 1 · won 1 · lost 0+4.9Anecdote

    Lead with the sample: three or more meetings is a finding, two is indicative, one is an anecdote.

    Back to the nets

    At most three changes. Each names the unit, not a child, and carries a number to re-run next season.

    Coach view
    1

    Give the strike bowling the overs it earns Insufficient evidence

    What the data shows
    Left-arm medium-fast took 17.1% of the wickets from 13.9% of the overs, a wicket every 21.0 balls.
    Likely cause
    A captaincy and match-management pattern, not a bowling fault.
    How we will know
    Left-arm medium-fast share of overs within 3 points of its share of wickets next season.
    2

    Fix the getting-in problem at the top Strong evidence

    What the data shows
    11 of 24 innings at positions 1 to 3 ended on 10 or fewer (45.8%).
    Likely cause
    Hypothesis: survival in the first ten balls. Check entry context and video before naming a cause.
    How we will know
    Under 30% of top-order innings ending on 10 or fewer over the next 10 innings.

    What this source cannot tell you

    • Dot-ball percentage: needs ball-by-ball data.
    • Fours and sixes conceded by a bowler: scorecards record boundaries against the batter.
    • Balls faced against pace and spin: only dismissal counts by bowler type.
    • Drops, saves and ground fielding: scorecards hold catches, stumpings and run-outs only.

    Swipe for more dashboard questions.

    Who scores, how, and how do they get out?

    Wagon wheel

    Runs by zone for every batter in this filter, from the batter's view

    Right-hander
    60Mid-on24Mid-off30Cover31Point30Third man18Fine leg77Square leg55Mid-wicket Bowler's endLegOff

    325 runs off the bat in zoned shots

    Based on 3 of 16 matches (CreaseTech scorer). Shown only when the scoring source carries ball-by-ball data.

    Sample data.

    What needs my attention?

    What needs attention

    Each check compares the chosen squad and term with a working threshold, and says what the result means.

    All squads
    Alerts3
    To watch3
    OK3
    StatusAreaCheckValueThresholdWhat it means
    AlertDiscipline coverageBatting share of drill minutes66.9%at most 45%Batting takes 66.9% of drill minutes, so bowlers, keepers and fielders get less of their own work.
    AlertDiscipline coverageSpin-bowling share of drill minutes0.0%at least 2%No spin-bowling drills were run.
    AlertPractice ladderMatch-scenario share14.1%at least 15%Only 14.1% of practice is match scenarios: players rarely train under match conditions.
    WatchEngagementAttendance84.0%at least 85%Attendance is 84%: about one player in 6 misses each session.
    WatchEngagementFeedback coverage55.2%at least 60%Only 55.2% of players who attended got an individual rating.
    WatchCurriculum balancePhysical share of drill minutes9.2%at least 10%Physical work is 9.2% of drill minutes, below the working floor.
    OKDeliveryPlan drills delivered87.9%at least 75%87.9% of plan drills were run at least once.
    OKCurriculum balanceTactical share of drill minutes13.9%at least 10%Tactical work is 13.9% of drill minutes.
    OKDiscipline coveragePace-bowling share of drill minutes3.5%at least 3%Pace bowling is 3.5% of drill minutes.
    Sample data, one synthetic season. Thresholds are working values.

    What leaves, what stays?

    Who holds the runs and wickets

    ODI · ages on 1 Sept against the U19 limit

    U19
    Wickets leaving with 7 players81.8%
    Runs in next year's final-year group57.5%
    1. Runs487 total42.5%leaving
    2. Wickets22 total81.8%leaving
    3. Catches and stumpings10 total70.0%leaving
    • Leaving after this season
    • Final year next season
    Sample data.

    Are we delivering the plan?

    Every session, week by week

    Each square is one session. Squads train twice a week.

    4 squads
    Completed109 of 120
    Shortened5
    Cancelled6
    • Completed
    • Shortened
    • Cancelled
    Sample data.

    Most of the people on this platform are children.

    It has been designed accordingly. Nothing about a young player becomes visible beyond their institution unless the right people have agreed to it.

    Who built CreaseTech?

    Five people who came to CreaseTech from different ends of the game: the nets, the scorebook, the server room. Pick a card to meet the person behind the role.

    Five Minds.One Passion.

    • Take guard

    Start the conversation here.

    Tell us who you are. We will write the first message for you, and you can forward it to your committee as well.

    We are a

    This writes itself as you fill in the form. Change anything you like. Please leave out any details about a child.

    A founder replies to every message. Nothing is shared outside the founding team. No payment, and no child’s details needed.

    Demo

    Sample data

    Take guard